Visual Factory
The visual factory improves the operability of production using real-time information panels.
All data in full view of everyone
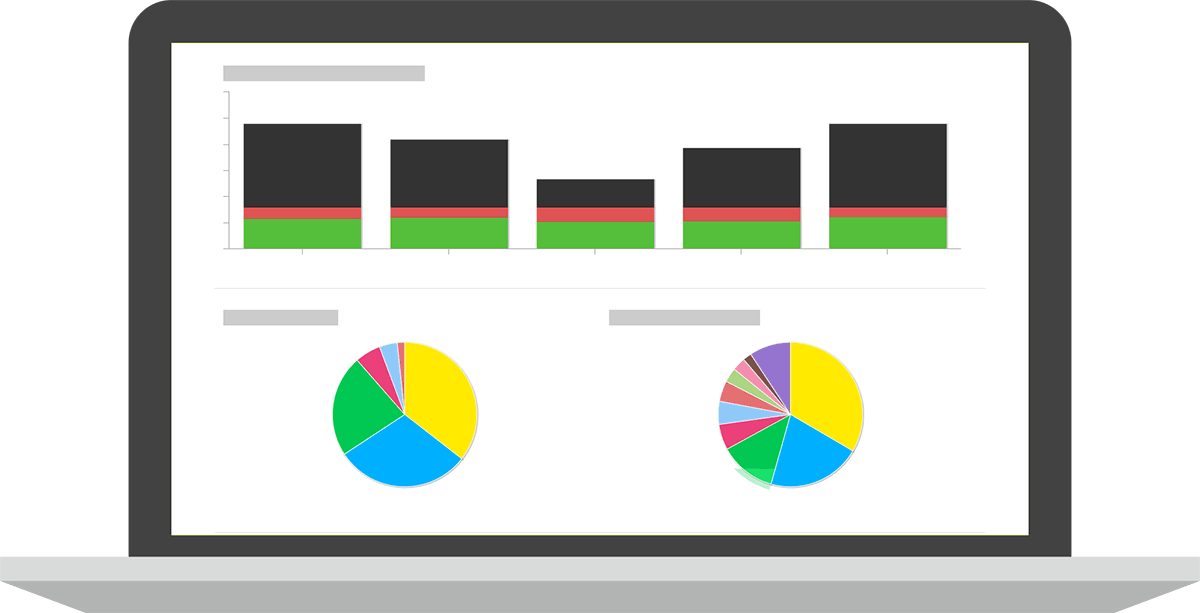
The doeet Visual Factory module allows you to generate large-format projections and screens with data on the status of manufacturing, to be viewed by all factory plant personnel.
The displays show machines running or stopped, the status of production orders or the overall efficiency of the equipment.
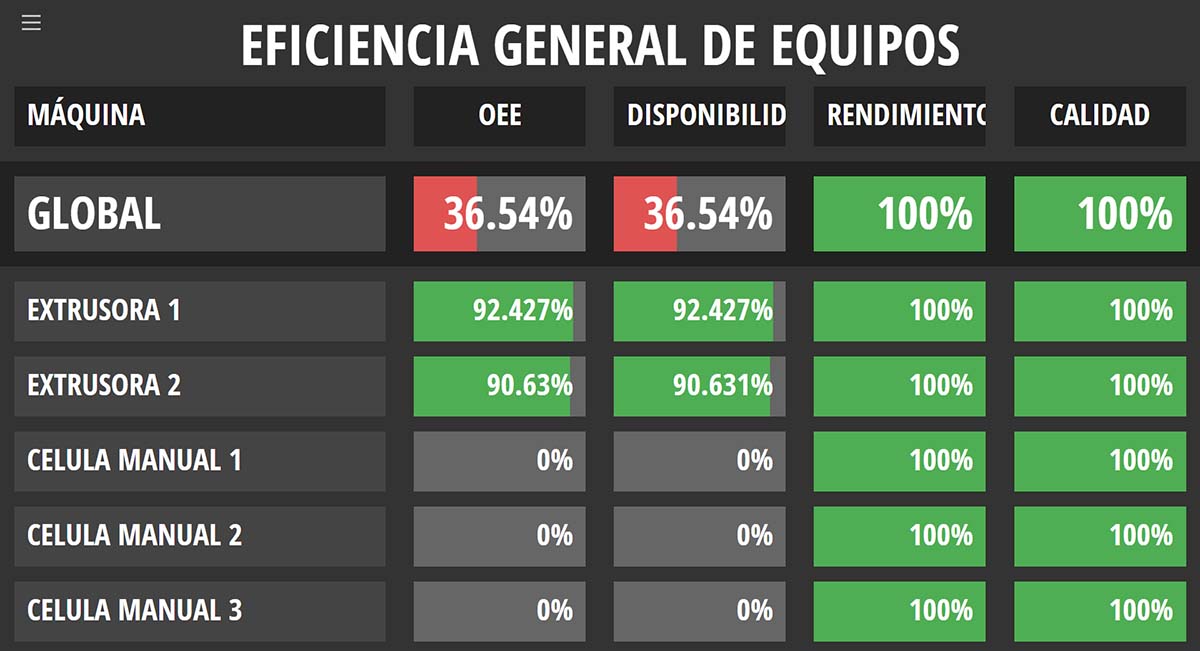
Visual factory of overall equipment efficiency
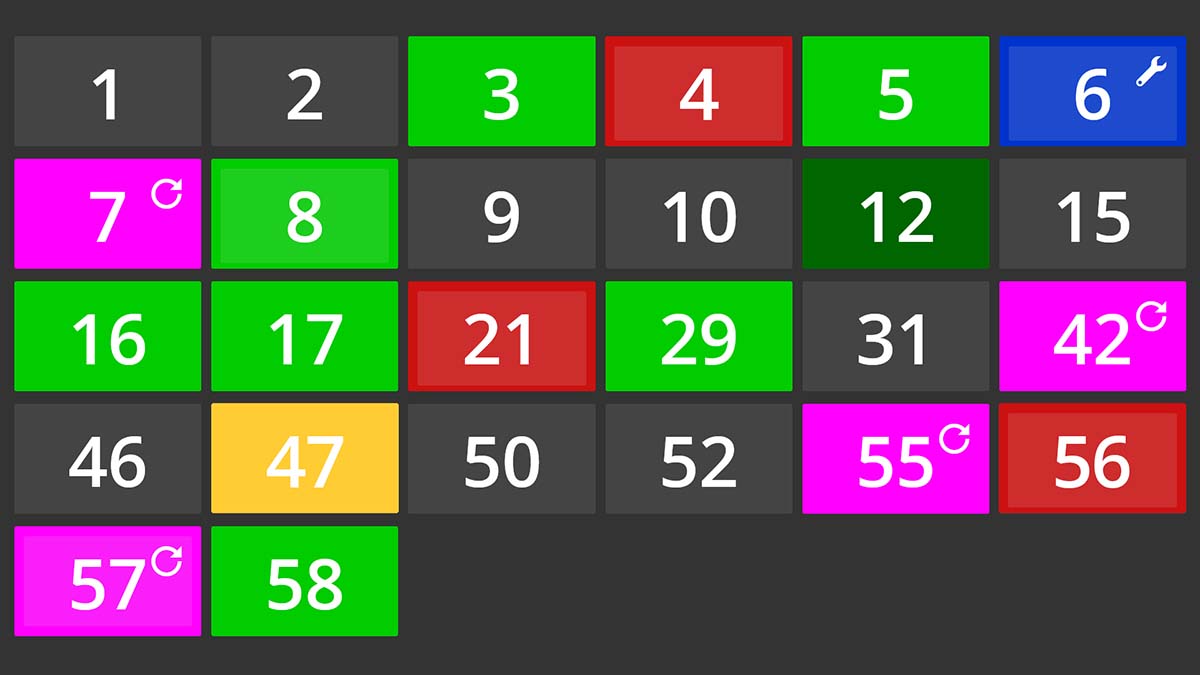
Visual machine status factory
Improve your processes with information
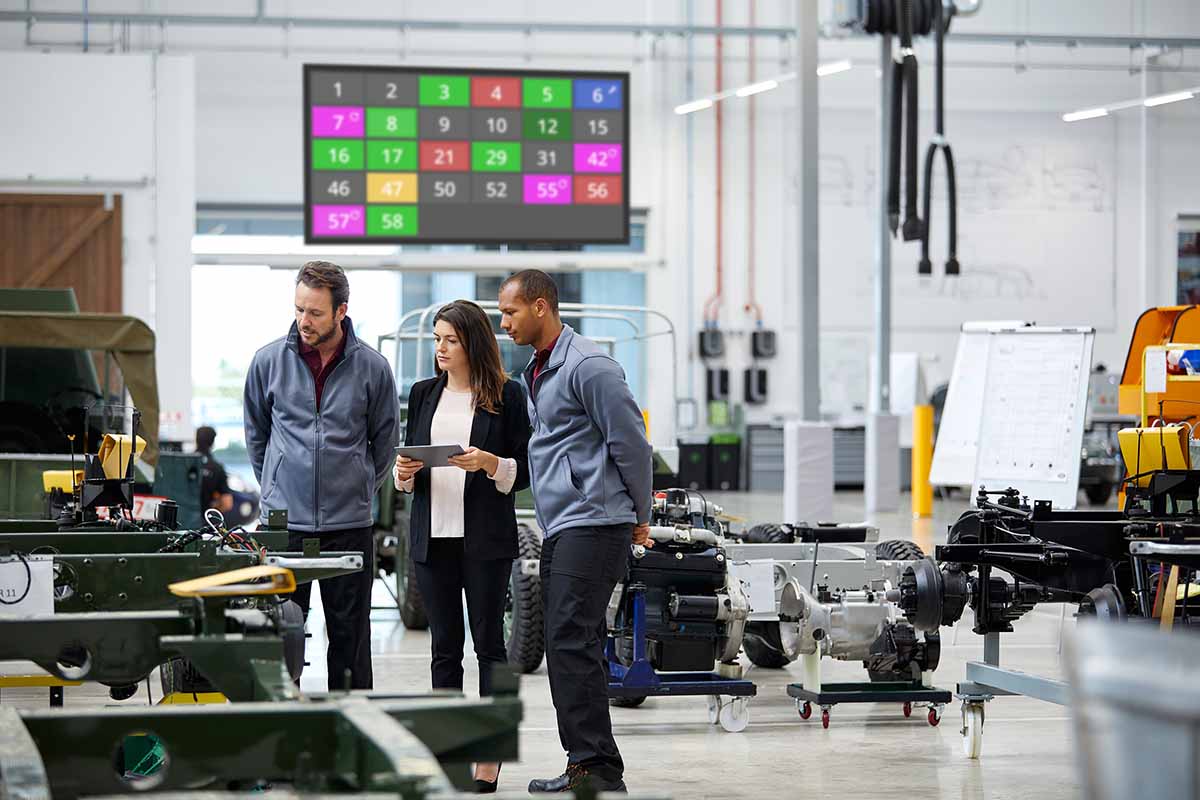
Communicate the status of your production by displaying in real time the status of all your machines. View your Visual Factory dashboards from any mobile device and any location, even off-site.
Sharing production status with your operators avoids organizational problems and improves the involvement of all personnel.
Visual factory with customizable panels
The objective of the visual factory is to provide reliable, up-to-date and functional information to improve the operability of production.
Five screen formats are available with different production data, from machine status and production orders to overall equipment efficiency, along with a colour legend defining asset statuses.
Create customized dashboards with the production data you need, automatically updated and focused not only on displaying relevant information but also on improving operability.

Visual factory of completed orders
Advantages of the Visual Factory in production
Visually monitor the status of your production at all times.
Customize the relevant data to be displayed to operators.
Share with the different operational areas what is happening in the factory.
Immediately report any production issues for a quick solution.
Overall equipment efficiency
Visualize in different bar graphs the current values of the universal production KPIs: the actual OEE efficiency, availability, throughput and quality of each machine.
The display shows the values of the OEE indicators for all lines and compares them with the target values specified in the system.
Visual machine status factory
A grid with sections represents the machines of the production factory. The colour indicates the status of each machine: green in standby, red in shutdown, grey non-operational, orange in standby and blue in failure.
We can incorporate secondary data for each machine, such as the current downtime or the production order on the machine.
Panels of orders completed or pending be manufactured
These screens show, in a table format, the completed production orders, the next orders to be completed and the next orders to be produced. We can know for each order the start time, the machine, the item and the current quantity of good units produced.
Functions of the doeet visual factory

- Display of panels with relevant production data and graphs.
- Visualization of production data in the factory plant or the office.
- Customization of the data displayed in the panels.
- Machine status indicators: stop, running, low speed.
- Visualization of the OEE productivity of each machine: availability, performance and quality.
Other doeet solutions for Factory Plant Control